Overview
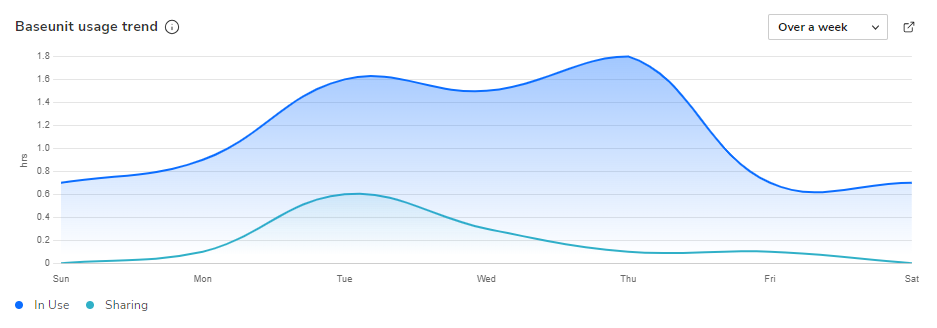
The Base Unit usage trend pane displays the usage of the connected Base Unit devices in a graphical form. The graph gives an indication of the time the devices are in use, as well as the time the device is used to share content.
The graph displays average usage of all Base Unit devices on a daily basis (weekly view), or on hourly basis (daily view). The last 30 days of data is used for calculating the average.
By clicking the expand icon in the top-right corner of the pane, you will be redirected to the Usage Insights page. For more info, see “Usage insights”